ChatOps connects people, tools, processes, and automation into a fluid workflow, enabling conversation-driven development through a chat client like Slack. With ChatOps, members of your team can type commands that the chatbot is configured to execute through custom scripts and plugins. By tailoring a chatbot to work with your team’s tools, plugins, and scripts, your team can automate tasks, collaborate in real time, and gain valuable fast feedback.
Here, I’ll share some best practices for local development of a ChatOps bot.
Prerequisites
To follow along with this ChatOps tutorial, you’ll need to install and set up the following. The versions being used during this tutorial follow each dependency in parentheses.
- Docker (v18.09.1)
- Docker Compose (v1.23.2)
- Node.js (v11.6.0)
- Visual Studio Code (v.1.30.2)
This ChatOps tutorial will use a web bot with the Botkit framework. Botkit is an open source bot framework available on GitHub that allows anyone to extend its features to create a better chat experience. Liatrio uses Botkit’s framework with Slack, but here I’ll be using a fresh web bot with no extra features. If you don’t yet have a bot, then check out Botkit’s get started documentation.
This tutorial also assumes you have a basic working knowledge of Docker, Node.js, and the command line, as well as a basic understanding of web application development.
Get Started with ChatOps
Create a bot if you haven’t yet. Open a terminal and navigate to the bot’s directory. The code for my bot and all supporting files can be found here.
First, we need to give the bot somewhere to live. Many environment options exist, including VMs, containers, and serverless. Here, I’ll focus on containers, in particular, Docker.Open your favorite editor or IDE and create a file named Dockerfile. The contents are as follows:
Breaking down the Dockerfile:
- Use the 11.6.0-alpine image as the base for the bot’s image. (Use the Official Node image from Dockerhub.)
- Copy in the code and move to that directory. (Later you can be more specific regarding the files you’re interested in.)
- Install the dependencies and nodemon for use during debugging.
Entrypoint will then run the bot upon container startup.
Run the ChatOps Bot!
First we need to build the image, which can take time if it’s the first run. Build the image using the following command in the terminal:
Once the build is complete, you can run docker image ls to see if the image is there. Here is some sample output:

Excellent! The bot image is now ready, so let’s run it! We need to run the container and forward port 3000 to be able to interact with the bot in a browser. The command is as follows:
Navigate to http://localhost:3000, and you should able to see the bot. Say hello to the bot as I have in the gif below.
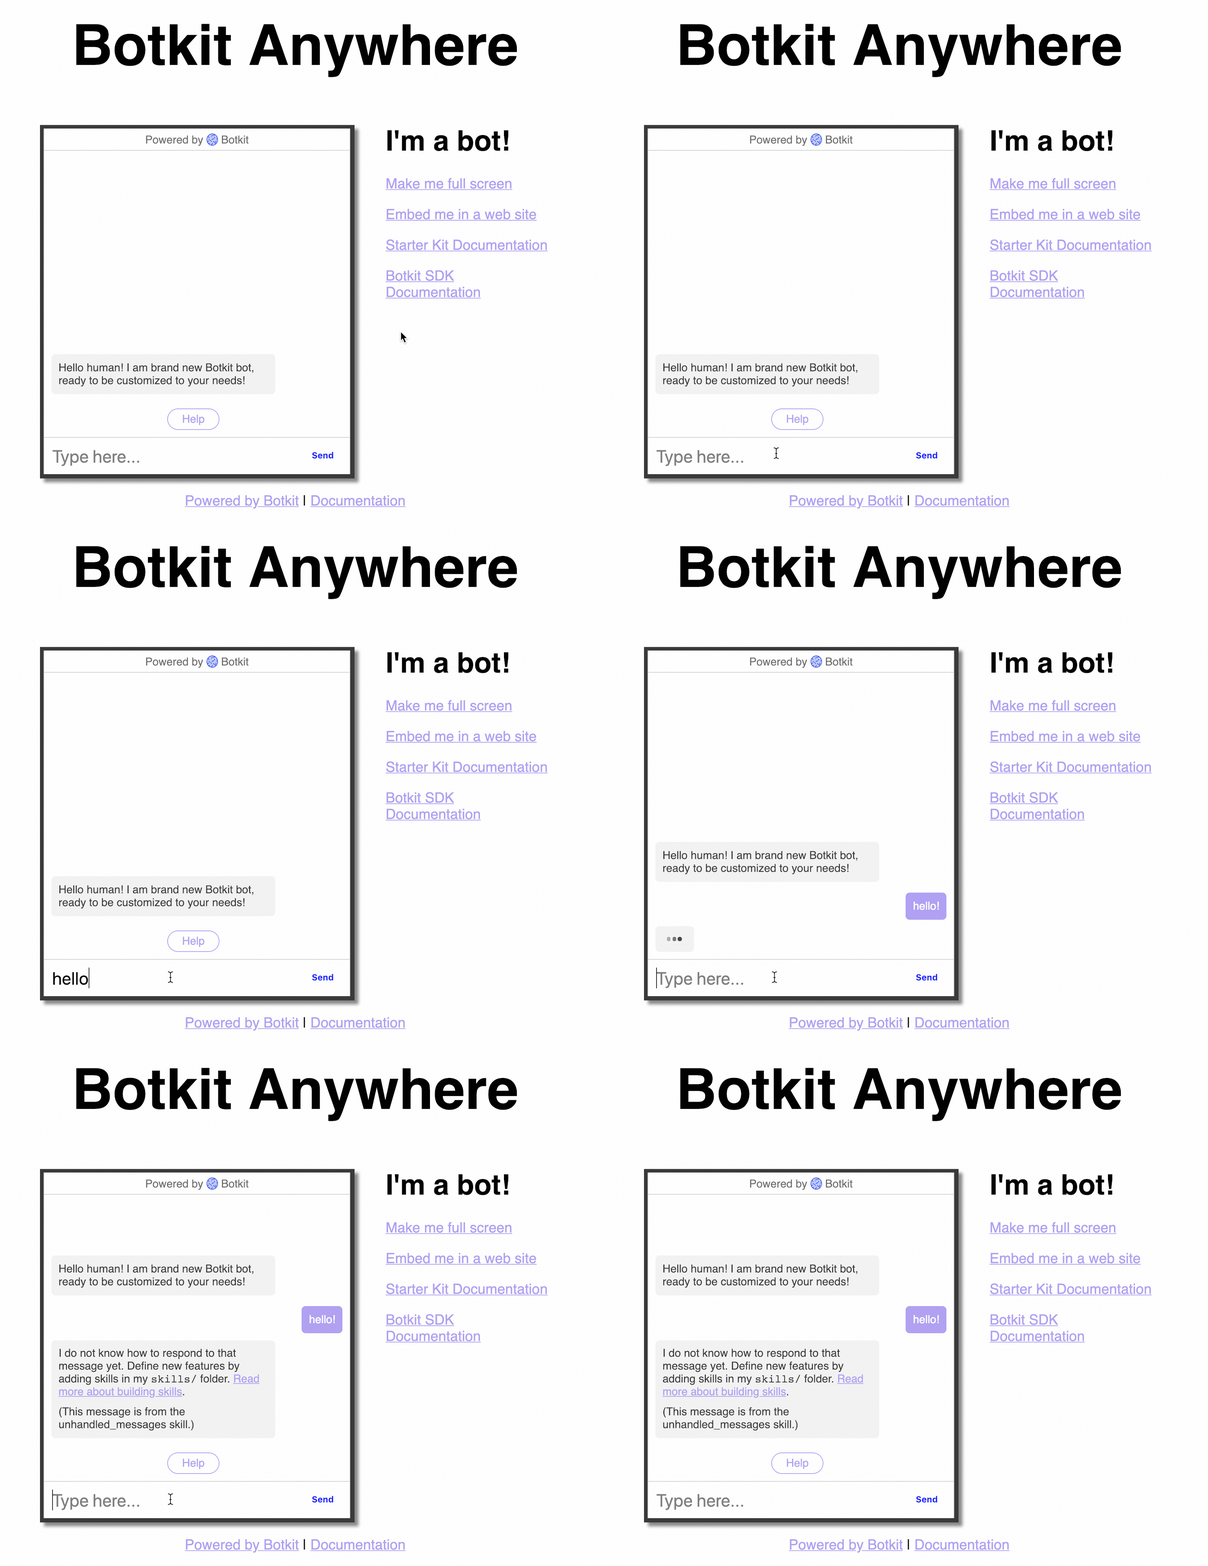
As you can see, the bot doesn’t yet have a response. Let’s complete the setup for local development and then get the bot to respond to some greetings.
Here, we’ll stop the Node process and use Docker Compose.
Create a docker-compose.yml
Running a Docker container via command line is fun, but those commands can get pretty nasty as you add more flags. A nice way to get around this problem and develop locally is to use Docker Compose. Docker Compose allows a team to run more complex Docker setups without the complicated command line kung fu or robustness of a full blown container orchestrator like Kubernetes. Also, configuration as code is wonderful — commit it.
We’re now going create a docker-compose.yml and a docker-compose.debug.yml. The docker-compose.yml will be the yaml used to run the bot like normal. The debug configuration will extend the docker-compose.yml to allow for local debugging. Let’s dive in.
The docker-compose.yml file:
This docker-compose.yml file will allow you to build and run the container using docker-compose build and docker-compose up. Run docker-compose up now, and you should see similar output as before.

As your ChatOps bot grows, you will likely need to add more to the docker-compose.yml file. For example, we follow 12 Factor App’s recommendation of storing configuration as environment variables. We also used docker-compose to grab local environment variables for use during development. This makes deployment less scary because the production environment and local development environments can have their own variables and assets (like a database connection or keys). You can verify the bot works without taking down or breaking the known good bot by testing your chatbot with pre-production assets.
Let’s move on to the docker-compose.debug.yml file. This file is going to extend the original compose file. The purpose of this file is to open up the ports to be used with the debugger. The main things to notice are that the 9229 port is mapped and the entrypoint command is being overwritten with a NPM script call.
Note: We are using version 2 compose files because version 3 broke the extends capability. We are looking into new ways to create a standard debug environment, so reach out or leave a comment if you have suggestions!
Use the following command to run the debug composition:

What happened? It failed because it’s looking for the debug script. Let’s add it!
Add the NPM Debug Script
We need to add the debug script to the package.json file. Here’s the inline script:
Let’s break it down:
- debug – the script’s name
- nodemon – open source utility to automatically restart your server when changes are detected
- –nolazy – Node.js flag that enables us to use breakpoints in the editor
- –inspect – sets up the address:port for the debugger
- Bot.js – the main file of the bot
We will add this command in the scripts section of the package.json.
Once the command is added to the package.json file, you will need to rerun docker-compose build. Then run docker-compose -f docker-compose.debug.yml up. You should see similar output upon success.
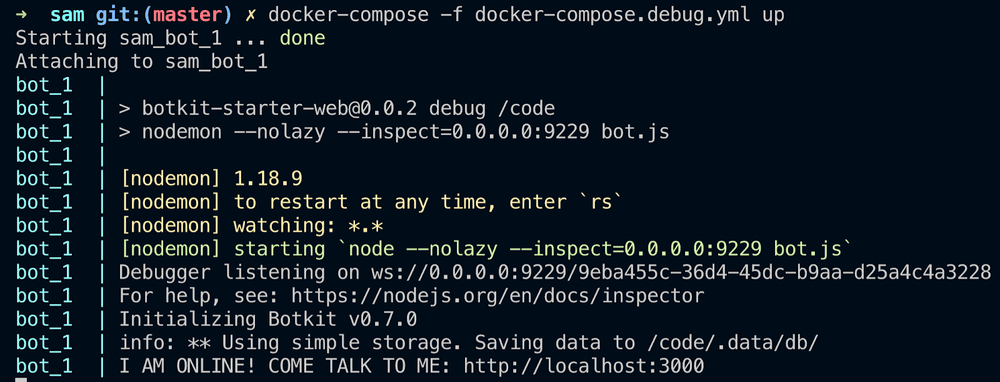
The image above shows the bot startup using nodemon and the debugger listening on the port. You’re now ready to start writing code — almost.
Attach the Debugger
It’s nice to have a good debugger by your side. For this tutorial, we’ll connect Visual Studio Code (VSCode) to the debugger. VSCode is an open source text editor by Microsoft that supports many languages and extensions.
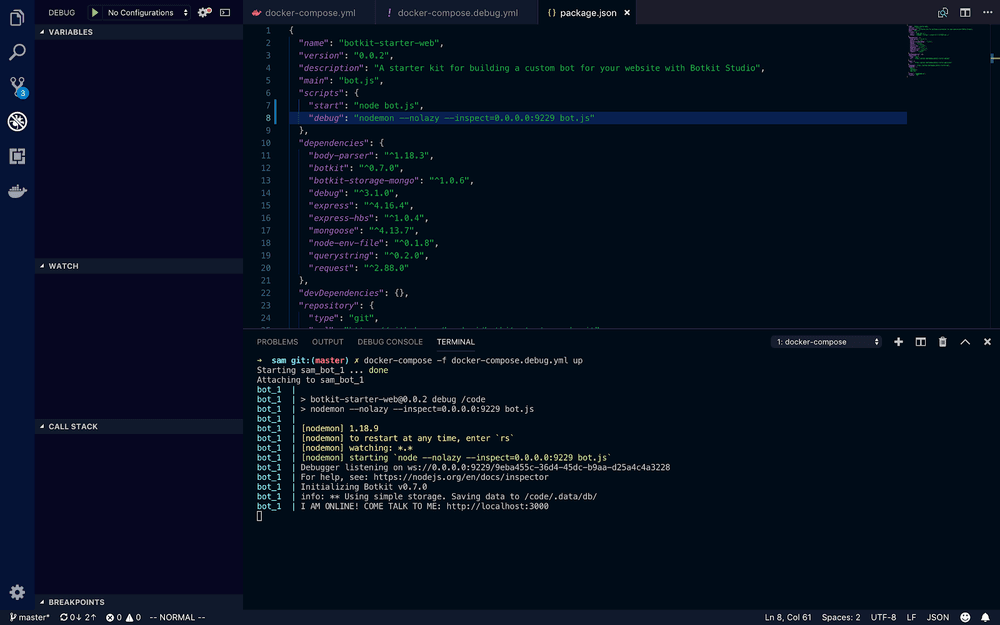
Here’s VSCode in the debug view. Open the debug view by clicking on the Debug icon in the left column.

We will need to create a new debug configuration. Click the No Configurations dropdown and select Add Configuration to create a new file called launch.json in the .vscode directory. (If the file already existed, then VSCode will add another configuration in the same file.) We have to make a few changes to the file:
- Update remoteRoot to point to the /code/ directory.
- Add port and address information for the debugger.
- Add localRoot configuration for VSCode.
- Enable Restart to automatically allow restarts of the session.
- Set Protocol to Node’s inspector for the debugger.
Check out the completed /.vscode/launch.json below.
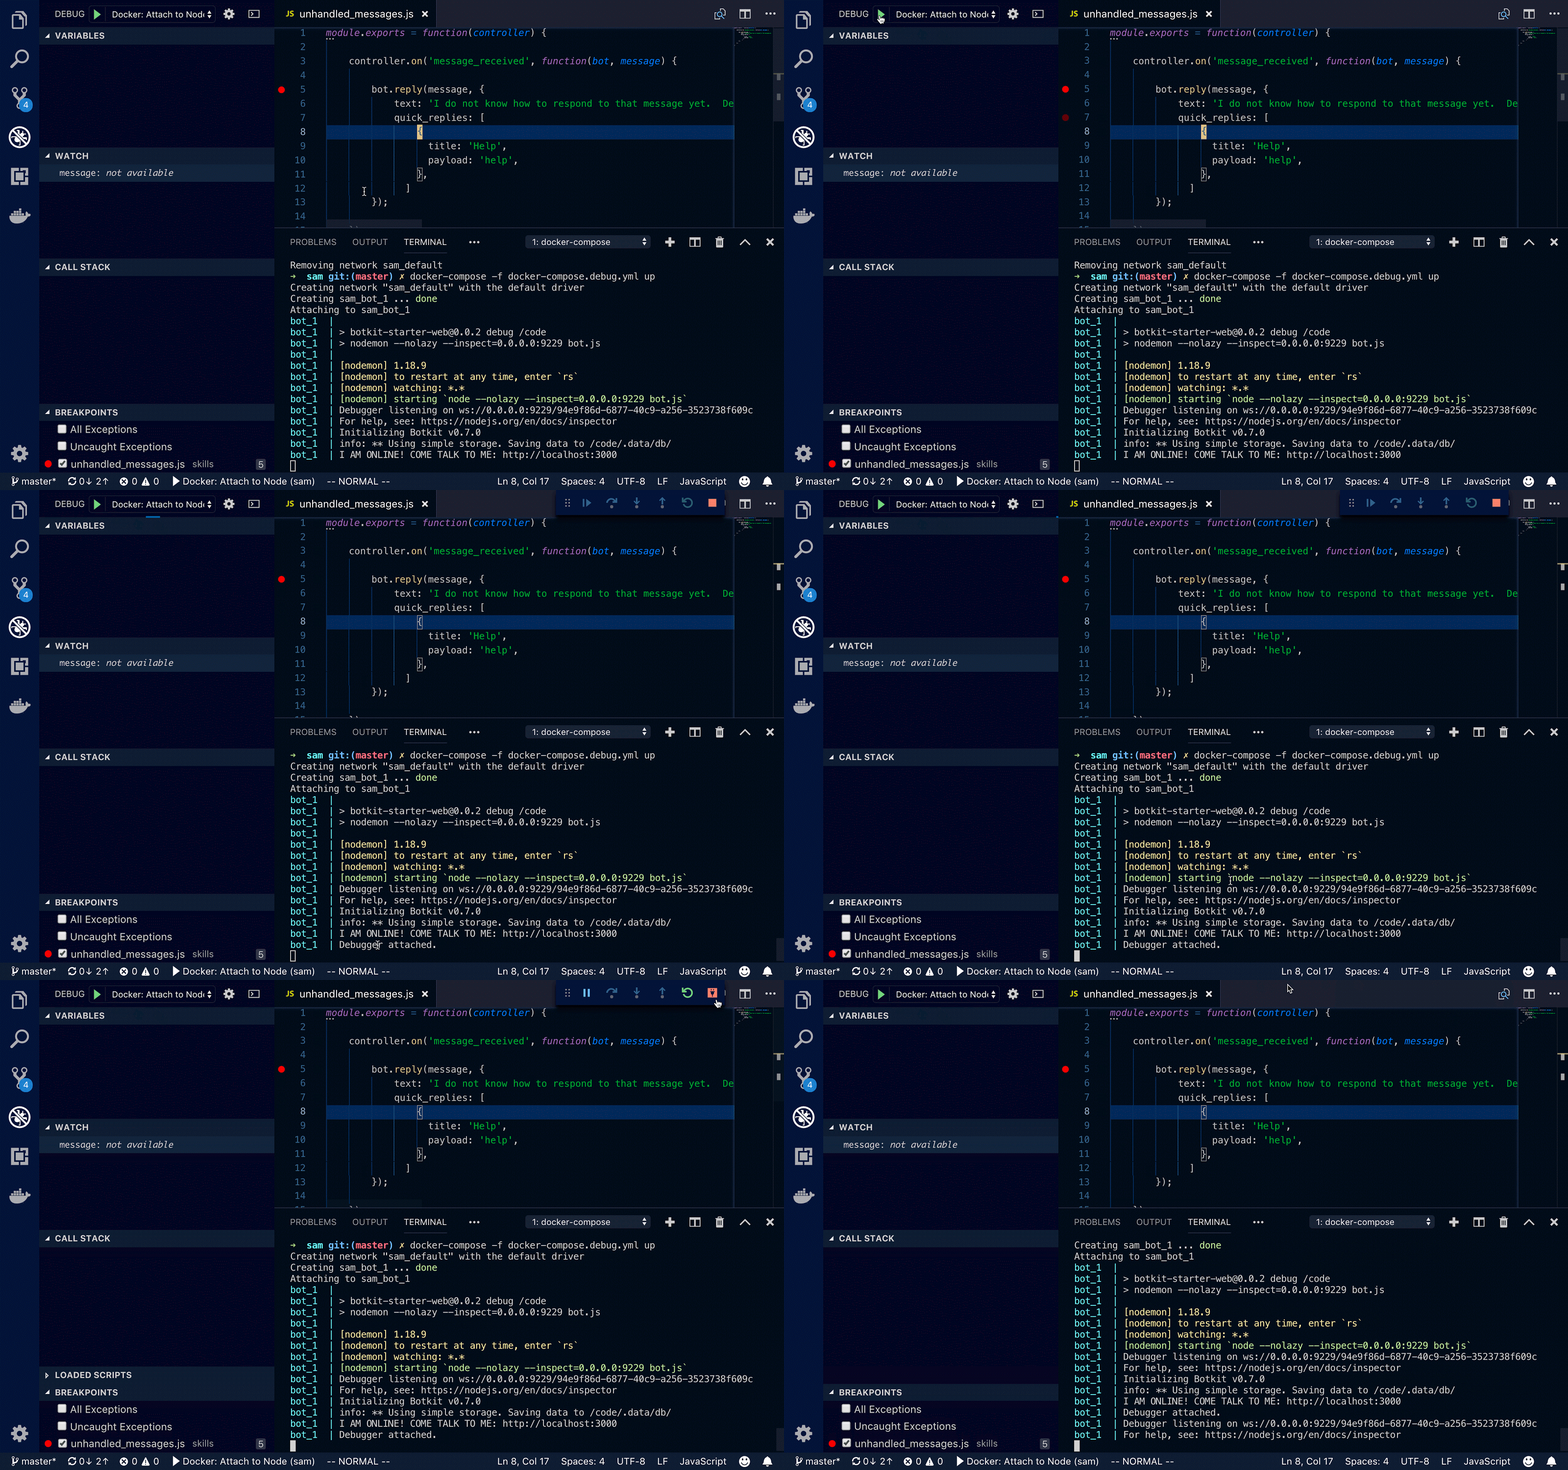
If your previous debugging session is closed, then rerun docker-compose -f docker-compose.debug.yml up. Connect your debugger by clicking the green arrow next to the debug configuration dropdown. You should see a debugger attached alert in the console. See the gif below for expected behavior.
Develop a ChatBot Feature
Awesome! We now have the tools necessary to do some debugging. Let’s update the unhandled messages skill. If you recall, a simple message would pop up if the bot didn’t know how to respond.
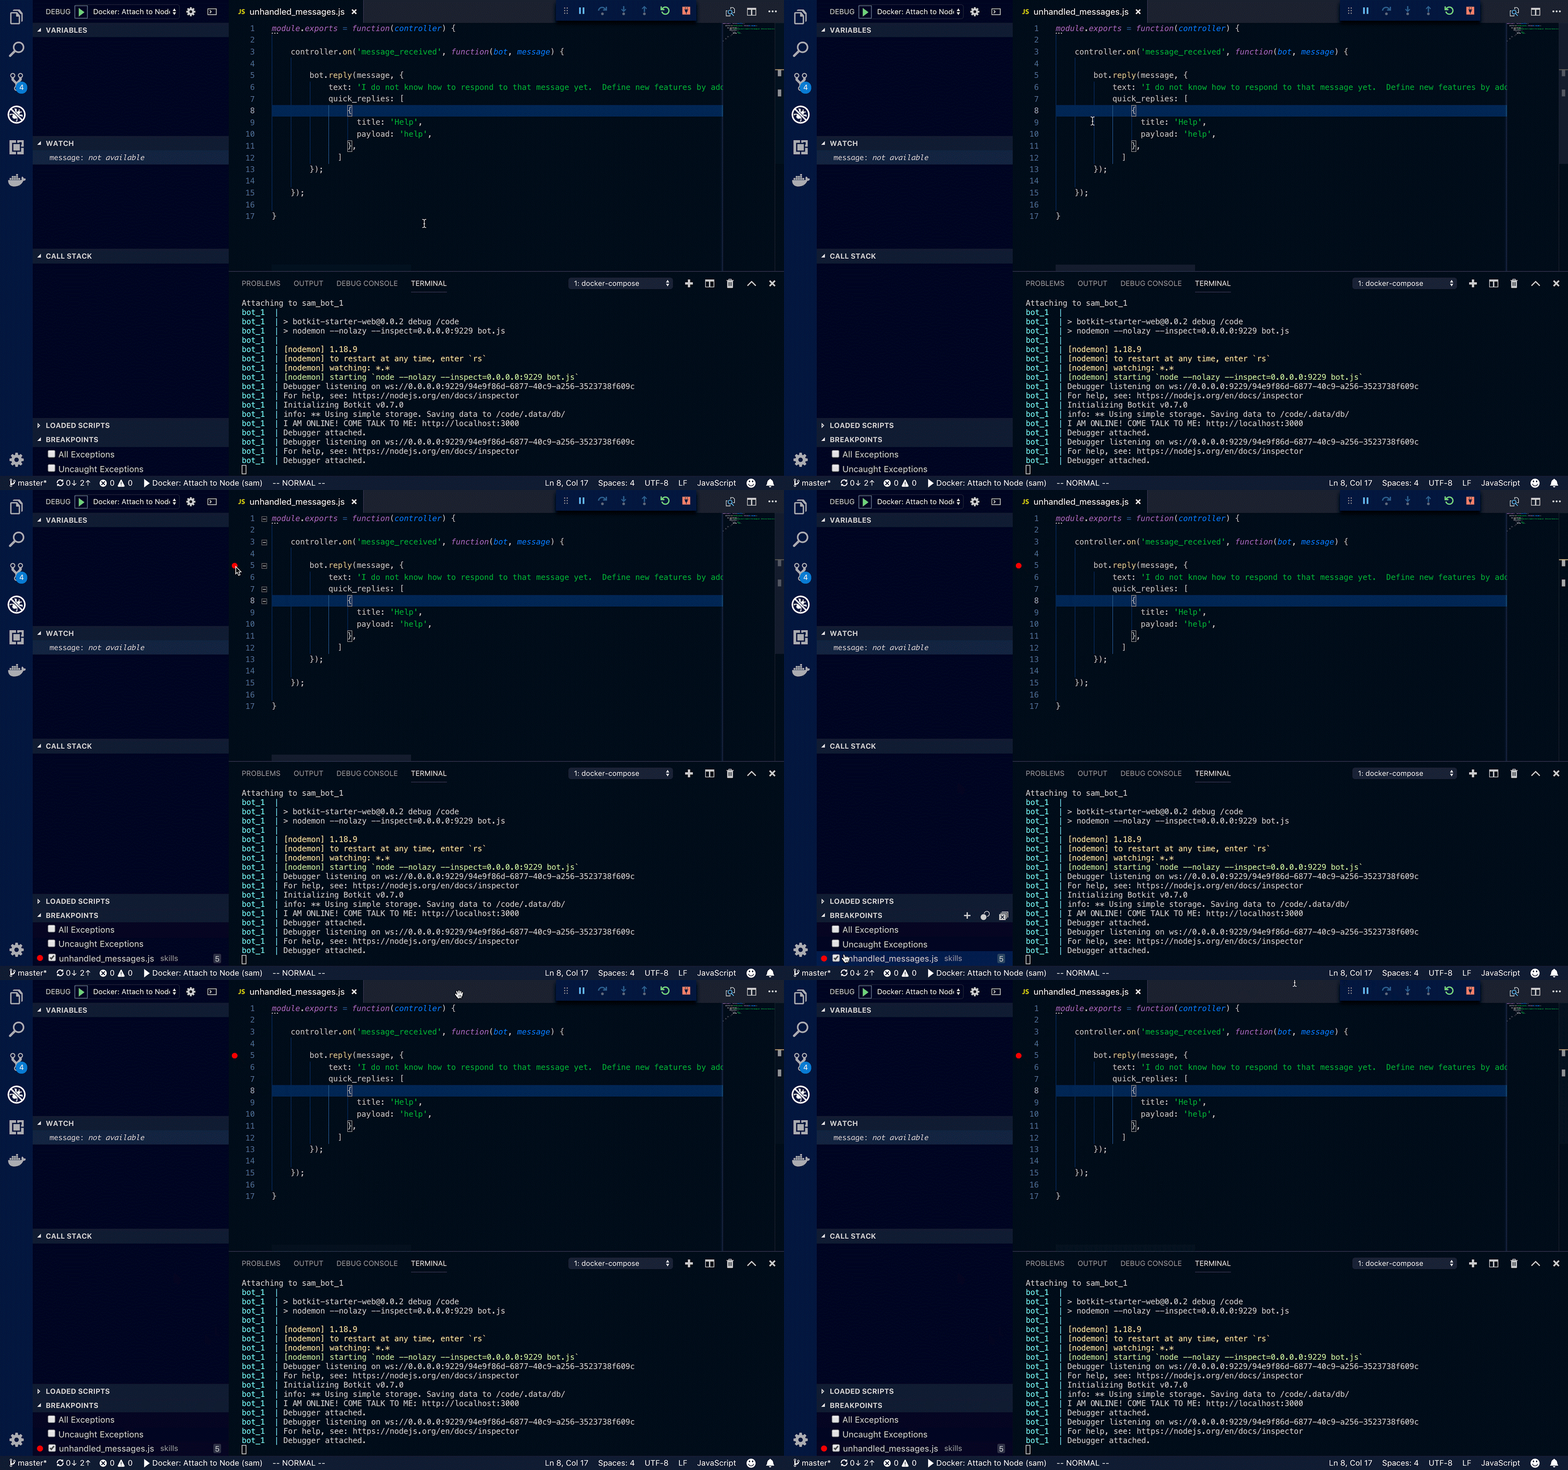
From this point on, we are assuming that the session is running and the debugger is attached. Open /skills/unhandled_messages.js. Let’s set a breakpoint where the bot is going to reply to the user (roughly line 5). Using your mouse, click to the left of the number, and a red dot should appear indicating a breakpoint.
The debugger is now listening. Say “hello,” and the application will refocus on vscode and show you information at the breakpoint.
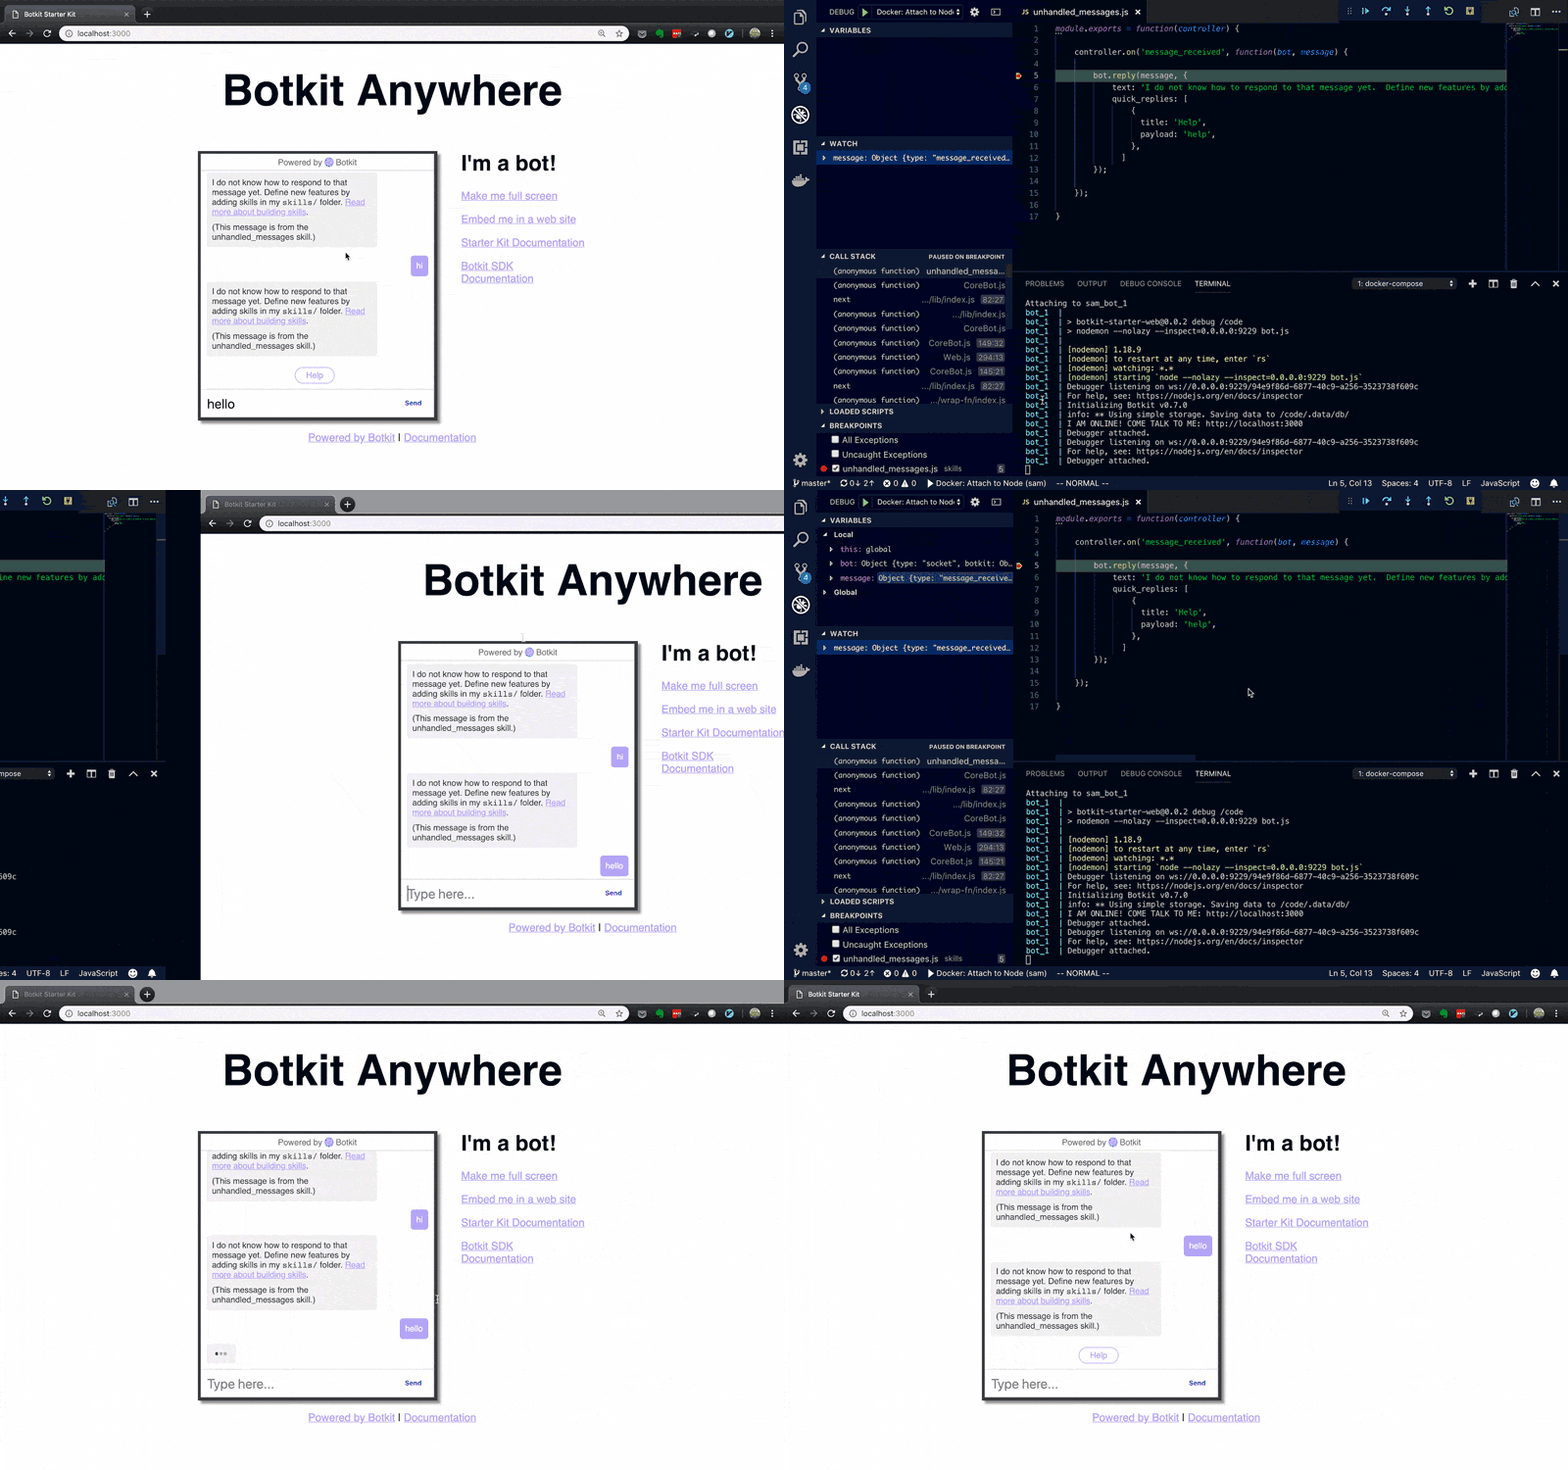
Notice that the bot doesn’t do anything until you click the play button, which allows you to take your time looking at the information.
At this point, the application is up, and the breakpoint is set. In order to return a different message, change the response text in the unhandled_messages.js file (roughly line 6) and save to trigger the nodemon to rerun the server bringing in your changes. You don’t have to run the debugger if you don’t need it at that moment (save yourself some screen switching).
To end a session, click the red plug button on the debugger control bar. Run docker-compose down in the console to bring down any compose session.
Local ChatOps Development
Above, I shared some best practices for local ChatOps development and a Chatbot development workflow. Of course, there are many variations of local dev with various tooling, and you can choose the toolset and workflow that fit your needs. If you have any ideas or suggestions you’d like to share, then don’t hesitate to reach out! We’re always learning!


